📊 Basics of a Candlestick
Each candlestick represents price movement over a certain period (e.g., 1 minute, 1 hour, 1 day):
- Open: Price at the beginning of the time period
- Close: Price at the end of the time period
- High: Highest price during the time period
- Low: Lowest price during the time period
- Body: The range between open and close
- Wicks (Shadows): Lines above and below the body showing the high and low
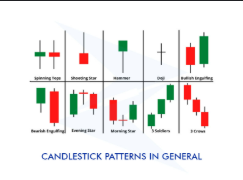
🔍 Common Candlestick Patterns in Forex
🟩 Bullish Reversal Patterns (Price might go up)
| Pattern | Description |
|---|
| Hammer | Small body, long lower wick, occurs after a downtrend |
| Bullish Engulfing | Large bullish candle engulfs the previous bearish candle |
| Morning Star | Three candles: bearish → small indecision → strong bullish |
| Piercing Line | Bullish candle opens below and closes above the midpoint of previous bearish candle |
🟥 Bearish Reversal Patterns (Price might go down)
| Pattern | Description |
|---|
| Shooting Star | Small body, long upper wick, occurs after an uptrend |
| Bearish Engulfing | Large bearish candle engulfs the previous bullish candle |
| Evening Star | Three candles: bullish → small indecision → strong bearish |
| Dark Cloud Cover | Bearish candle opens above and closes below midpoint of previous bullish candle |
⚖️ Continuation Patterns (Trend might continue)
| Pattern | Description |
|---|
| Doji | Open and close are nearly the same; shows indecision |
| Spinning Top | Small body with long wicks; also signals indecision |
| Rising Three Methods | Small bearish candles inside two large bullish ones |
| Falling Three Methods | Small bullish candles inside two large bearish ones |
✅ How to Use Candlestick Patterns
- Context is key: Always look at the trend and support/resistance zones.
- Confirmation: Wait for confirmation before entering a trade (e.g., volume, next candle).
- Combine with other tools: Use indicators like RSI, Moving Averages, or Fibonacci.
- Risk management: Patterns are not 100% accurate — always use stop-losses.
